The Global Oat Popularity Index

What does the world do with oats?

Pick a place on the map ↓

Turns out the world cannot agree on what to do with oats. Good for this study, probably.

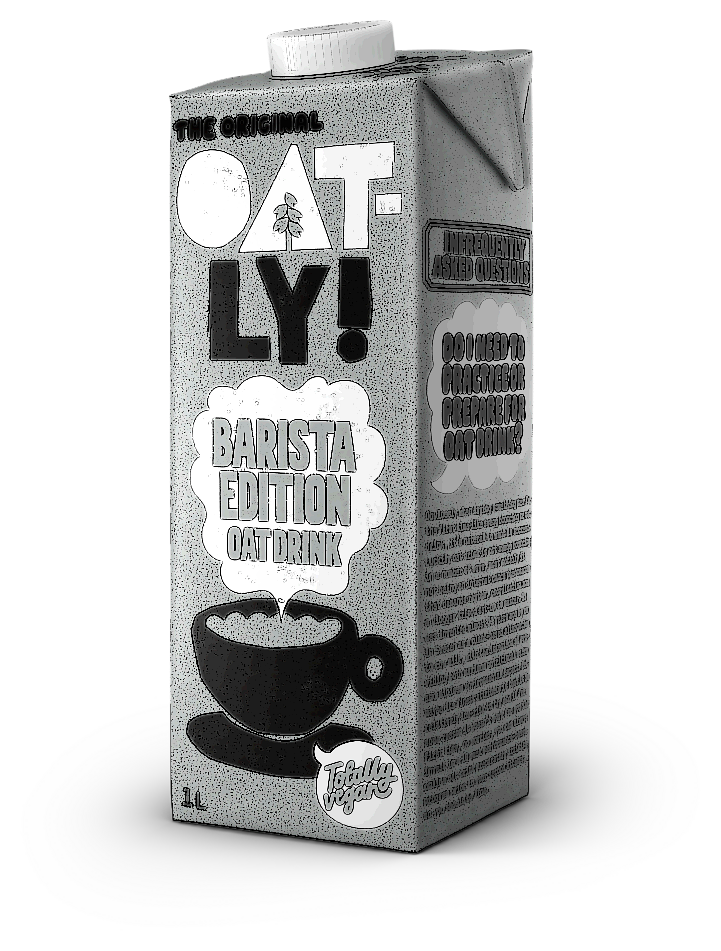
Oatly Barista Edition oat drink carton
The world according to oats

Oats around the world

Pick a place. We'll tell you what's up with their oats. (preferred oat product, local habits, modeled Planet Swap estimate)

Choose your oat destination

Interactive world map of ten oat markets Choose one of ten marked countries to update the oat receipt.
● Selectable marketFigures are illustrative modeled estimates

United Kingdom

OAT RECEIPT #003
Leading oat obsessionBarista oat drink
Illustrative preference44%
Most likely sightingSteaming behind a café counter
34.9 kgmodeled CO2e saved per person
1,980 Lmodeled water saved per person

The UK appears to enjoy oats most when somebody has drawn a leaf into the foam.

The Barista Crowd

Illustrative annual estimate based on modeled category swaps. It is not a live consumption measurement.

What we know

44%

The UK froths ahead

Barista oat drink leads the UK's modeled preferences, helped by a specialty-coffee culture that likes its swaps steamed.

48%

Sweden belongs to oatgurt

Breakfast and cultured oat products give Sweden the strongest oatgurt preference in the ten-market model.

37%

The US freezes its oats

Oat ice cream overperforms in the United States, where flavor and dessert formats make the swap feel less serious.

38.4

Sweden tops the swap

Its combination of frequency and category preference produces the model's highest annual per-person CO2e saving.

Where oats are really having a moment

The top oat cities

A compact per-capita Oat Density Score combining modeled frequency, product range, and category adoption.

The part where oats attempt to save something

What could the swaps add up to?

The Planet Swap model combines illustrative servings with fixed category conversion factors. The result is an estimate, not a claim that somebody followed every oat carton home.

Highest modeled annual CO2e saving38.4 kg
Highest modeled annual water saving2,200 L
Strongest swap categoryOatgurt

Per-person figures across the ten illustrative market profiles.

How we organized this entirely reasonable amount of oat information

A short methodology

This illustrative index models how a full international oat study could be presented using category preferences, consumption estimates, population data, and published environmental conversion factors.

  • Ten markets and ten featured cities
  • Four comparable product categories
  • Per-capita adjustments for market size
  • Fixed category swap factors for consistent estimates
  • One central dataset powering every receipt, chart, and finding
WHAT A REAL STUDY WOULD USE

Consumer panels, retail category sales, market reports, population statistics, and published product life-cycle assessments.

WHAT THIS PAGE USES
Controlled mock values created to demonstrate campaign strategy, branded data storytelling, and interactive front-end design.

No live feed. No secret global oat surveillance system. Sorry.